


Landslide hazard: a problem mainly for small municipalities
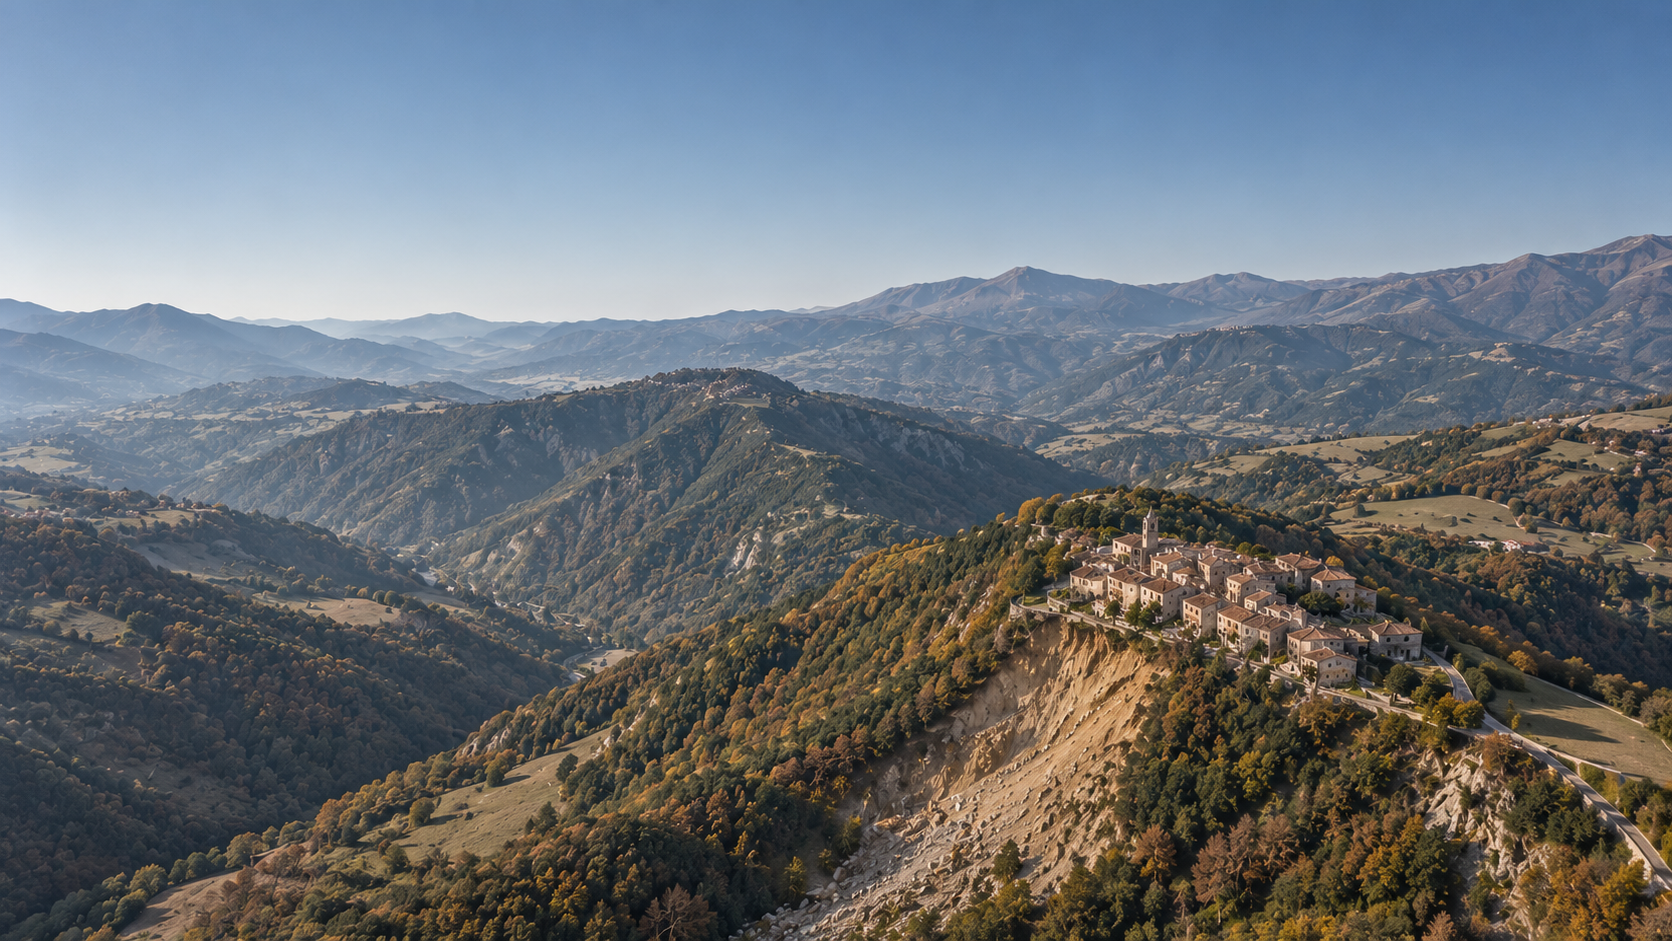
Of Italy’s 7,899 municipalities, 51.4% face at least one high hazard among landslides, floods and earthquakes. The analysis, based on data from ISPRA and the Civil Protection Department, shows that each hazard follows its own geography: earthquakes weigh on people, landslides on small municipalities in inner areas, floods on plains and cities. And among the 1,130 municipalities with fewer than 5,000 inhabitants exposed to landslides, 190 have no slope stabilisation project at all.
Three hazards, three geographies
Combining landslides, floods and earthquakes into a single index would be misleading: the three hazards have different causes and geographies, and a single value would hide precisely the information needed by those planning to make the territory safe. For each municipality, the analysis therefore looks at which hazards exceed a high threshold, using data from ISPRA (Italian Institute for Environmental Protection and Research) and the Civil Protection Department:
- Landslides: at least 10% of residents in areas of high or very high hazard (classes P3 and P4).
- Floods: at least 10% of residents in areas of high hazard (class P3).
- Earthquakes: municipality classified in seismic zone 1 or 2.
Hazard is not the same as risk. In ISPRA’s definition, hazard is the probability that a potentially destructive event of a given intensity occurs in a given area within a given period of time; risk is the expected damage, which also depends on the vulnerability and exposure of people and assets. This analysis measures hazard.
Earthquakes weigh on people, landslides on municipalities
Overall, 3,133 municipalities face high seismic hazard, 1,280 high landslide hazard and 719 high flood hazard. The picture changes, however, depending on whether municipalities or people are counted. Among municipalities exposed to a single hazard, earthquakes affect 2,200, with 22.2 million residents, 37.5% of the population; landslides alone affect 516 municipalities but just 1.2 million inhabitants, because they hit small towns; floods alone affect 330 municipalities with 3.7 million inhabitants, because they occur in plains and cities.
An indicator built on residents and one built on municipalities therefore lead to different orders of priority. Choosing which one to use is already a planning choice: making it explicit makes it defensible. The maps below show the starting point for both readings: the municipalities exceeding the high-hazard threshold, hazard by hazard.
Each hazard has its own geography
The hazards overlap less than one might expect. No significant link emerges between floods and earthquakes, and the shares of residents exposed to landslides and to floods move almost independently, with a correlation of +0.08. Only 60 municipalities face all three hazards.
Treating an area as generically fragile risks directing the same type of intervention towards municipalities with different needs. This is why the series looks at the three hazards one at a time, starting with landslides.
Landslide hazard: why it weighs on small municipalities
The 1,280 municipalities exposed to landslides share a clear profile: 75.2% are in inner areas and 88.3% have fewer than 5,000 inhabitants. It is a hazard spread across many small local authorities rather than concentrated in a few populous centres.
The share of municipalities exposed to landslides falls from 26.5% among those with fewer than 1,000 inhabitants to 2.7% among those with more than 20,000; for floods the trend is the opposite, from 6.4% to 12.4%. The result: municipalities with fewer than 5,000 inhabitants are home to 16.5% of Italians but to around 42% of those living in landslide areas.
The hazard is therefore concentrated in local authorities that, because of their size, generally have smaller technical departments. Here, the capacity to design an intervention and report on it matters as much as the availability of resources.
Landslides, floods and earthquakes rarely occur in the same municipality
Of the three hazards, landslides and earthquakes are the only pair that tends to go together: 53% of municipalities exposed to landslides are also exposed to earthquakes, compared with 40% of Italian municipalities overall, and the correlation between the shares of exposed residents rises to +0.27. Of the 60 municipalities facing all three hazards, about two thirds are in two regions, but the phenomenon is not confined to the South:
- Calabria: 24 municipalities with all three hazards and almost one in two (48.3%) with at least two; the entire population lives in seismic zone 1 or 2, 61.7% in zone 1.
- Campania: 15 municipalities with all three hazards; in Quindici, 64.2% of residents live in a landslide area and 54.7% in a flood area.
- Centre-North: Tuscany (3 municipalities), Emilia-Romagna and Veneto (2 each), including Bertinoro, with 10,984 inhabitants, the second-largest municipality on the list.
Almost all of them are small municipalities (the largest, San Felice a Cancello, has 16,963 inhabitants) and 60% are in inner areas. For these local authorities, the point is to try to bring together interventions of different kinds within the same programme: slopes, the drainage network, buildings.
Projects against landslides: what the sources say
To check whether projects reach the places where they are needed, three datasets were cross-referenced: cohesion policy projects, projects under the NRRP (National Recovery and Resilience Plan) and the works recorded in the public works monitoring system (MOP). The scope matters: the absence of a project in these sources means that the municipality does not appear among the recorded beneficiaries, not that no intervention is being carried out in its area, because works funded through other channels or classified differently may not be captured.
Of the 1,130 municipalities with fewer than 5,000 inhabitants exposed to landslides, 940 (83.2%) have at least one slope stabilisation project in the sources considered, while 190 (16.8%) have none.
The uncovered municipalities are concentrated in four regions, which together account for 130 of them: Piedmont (58), Liguria (27), Tuscany (26) and Aosta Valley (19). Relative to the number of exposed municipalities, the uncovered share is 38% in Tuscany, 37% in Aosta Valley, 36% in Liguria and 33% in Piedmont; in Campania, by contrast, every exposed municipality has at least one project.
Coverage does not mean adequacy: the presence of a project does not show whether the intervention is proportionate to the exposure. And the regional share is a summary indicator, while the 190 municipalities form a named list: the scale that matters for decisions remains the municipal one.
What it means for planners
Territorial fragility cannot be read through a single number, and for landslides the scale that matters is that of the individual municipality. The data suggest three readings:
- The list matters more than the average: the 190 municipalities without projects in the sources considered are a possible starting point for targeted technical support.
- Technical capacity is part of the picture: in small municipalities in inner areas, inter-municipal joint management is one of the levers available for designing projects and reporting on them.
- Landslides and earthquakes should be read together: where the two hazards coincide, planning has to bring together slopes and public buildings.
Bringing these indicators into the DUP (Single Programming Document) means using data to explain why one intervention is scheduled before another. When facing an oversight body or the public, it is the difference between a stated priority and a demonstrable one. What counts is which hazard, not how many. The next chapters of the series will apply the same reading to floods and earthquakes.